Understanding the Macro-Tech Probability Model (MTPM)
The Macro-Tech Probability Model (MTPM) is a sophisticated, data-driven framework developed by World Capital Management to forecast short-term market movements and provide actionable investment recommendations. By integrating macroeconomic data, technical indicators, and market internals through advanced mathematical tools, MTPM generates a probability score for market direction over the next 1-10 days. This model leverages concepts from linear algebra, calculus, probability and statistics, information theory, graph theory, optimization, discrete mathematics, numerical methods, Fourier analysis, and differential equations to process complex datasets, optimize predictions, and adapt to real-time conditions. Below, we break down how MTPM works, highlighting the fusion of its mathematical foundations with key inputs and processes.
Core Inputs: Macroeconomic Data and Technical Indicators
MTPM begins by analyzing a blend of macroeconomic and technical signals to capture both broad economic trends and granular market dynamics.
- Macroeconomic Data: The model evaluates key economic indicators, including inflation metrics (e.g., CPI and PCE), employment data (e.g., payrolls and unemployment rate), interest rates (e.g., 2-year and 10-year Treasury yields), and consumer confidence measures. These are normalized into scores ranging from 0 to 1, where higher values indicate bullish conditions (e.g., strong employment growth) and lower values signal bearish ones (e.g., rising inflation without offsetting factors). Using probability and statistics—such as Bayesian inference and maximum likelihood estimation (MLE)—MTPM assigns probabilistic weights to these indicators based on their historical impact on market outcomes, modeling uncertainty and estimating parameters that best fit observed data.
- Technical Indicators: To assess market momentum and price trends, MTPM incorporates tools like moving averages, RSI (Relative Strength Index), MACD (Moving Average Convergence Divergence), and volume metrics. These are similarly weighted and scored, providing insights into potential reversals or continuations. Graph theory plays a role here, representing indicators as nodes in a network where edges denote relationships (e.g., how RSI interacts with volume during volatility spikes). Attention mechanisms, akin to those in large language models (LLMs), allow the model to dynamically focus on the most relevant indicators at any time.
Market internals, such as sector performance and liquidity measures, are also factored in to refine these inputs, ensuring a holistic view.
Mathematical Foundations: Processing and Analyzing Data
MTPM’s power lies in its use of mathematical tools to transform raw data into predictive insights, emphasizing interactions between variables rather than isolated analysis.
- Linear Algebra and Matrix/Vector Operations: Data from macroeconomic and technical sources is represented as vectors and matrices, enabling efficient handling of large, multidimensional datasets. For example, a matrix might capture relationships between inflation rates and Treasury yields across time periods. Matrix multiplication processes this data through neural network layers, while eigenvalues/eigenvectors and techniques like Principal Component Analysis (PCA) or Singular Value Decomposition (SVD) reduce dimensionality, focusing on the most influential patterns. This vector-weighted approach allows MTPM to model interdependencies—such as how rising interest rates might amplify bearish signals from weak consumer confidence—leading to more nuanced predictions.
- Calculus and Optimization: Derivatives and gradients are used to optimize the model via backpropagation, adjusting parameters to minimize prediction errors. Optimization methods like gradient descent, stochastic gradient descent (SGD), and convex optimization principles iteratively refine weights, ensuring the model converges on the best-fit solution for market forecasts. Differential equations may model continuous changes in indicators over time, aiding in trend forecasting.
- Probability, Statistics, and Information Theory: Bayesian methods predict the likelihood of market uptrends or downtrends, incorporating entropy to quantify uncertainty and influence confidence levels. Cross-entropy loss and KL divergence measure how well the model’s predicted distributions align with actual market behavior, regularizing outputs to avoid overfitting. Discrete mathematics, including combinatorics, explores combinations of indicators (e.g., pairing RSI with employment data) to identify significant drivers, while automata theory processes sequential data for temporal dynamics.
- Additional Tools: Numerical methods, such as floating-point arithmetic and matrix factorization, ensure computational efficiency for real-time analysis. Fourier analysis helps detect cyclical patterns (e.g., seasonal effects in consumer confidence), though it’s not central. Overall, these tools enable MTPM to treat the market as a probabilistic graph, where nodes (indicators) and edges (relationships) are optimized for predictive accuracy.
The Matrix and Vector-Weighted Approach
Unlike simplistic models that evaluate factors in isolation, MTPM employs a matrix-weighted system to account for interactions. For instance, high inflation might be bullish in a low-interest-rate environment but bearish amid rising yields. Vectors represent individual scores, while matrices encode these interconnections, processed via linear algebra operations. This results in a more responsive model that adapts to contextual shifts, enhanced by continuous updates that incorporate the latest data feeds.
Generating the Market Probability Score
The weighted macroeconomic and technical scores are combined into a BaseScore. Guardrails—penalties for extreme conditions like high volatility or credit stress—are then applied, drawing on optimization techniques to adjust for outliers. The outcome is a FinalScore (0-1), where values closer to 1 indicate a higher probability of upward market movement. This score is derived probabilistically, using MLE to maximize alignment with historical outcomes.
ETF-Specific Recommendations and Broad-Based Investments
Based on the FinalScore and sector-specific factors (e.g., momentum, interest rates, currency fluctuations), MTPM provides tailored stances for ETFs like TQQQ (growth/tech focus), TECL (technology), and SHNY (leveraged gold). Recommendations include:
- Strong Buy (Score ≥ 0.75)
- Buy (Score 0.60–0.74)
- Hold/Neutral (Score 0.40–0.59)
- Sell or Strong Sell (Score < 0.25)
To enhance portfolio performance, MTPM advocates investing in broad-based, high-performance indexes via ETFs and ETNs, offering diversified exposure to growth sectors and improving liquidity for efficient market participation.
Model Outputs
MTPM’s outputs are designed for clarity and actionability:
- Market Probability Score
- Top bullish and bearish drivers
- Applied guardrails
- ETF stances with rationales
- A plain-English summary of the market outlook
This ensures users can quickly grasp the sentiment and make informed decisions.
Summary
In essence, the Macro-Tech Probability Model (MTPM) delivers a comprehensive, adaptive approach to market forecasting by fusing macroeconomic data, technical indicators, and market internals with a robust mathematical toolkit. Through vector-matrix weighting, probabilistic modeling, and continuous optimization, it provides real-time probability scores, ETF recommendations, and diversified investment strategies in high-performance indexes. This empowers investors to navigate dynamic markets with confidence, aligning predictions with evolving economic realities for superior portfolio outcomes.
_____________________________________________________________________________________________________________________________________________________________________________________________________
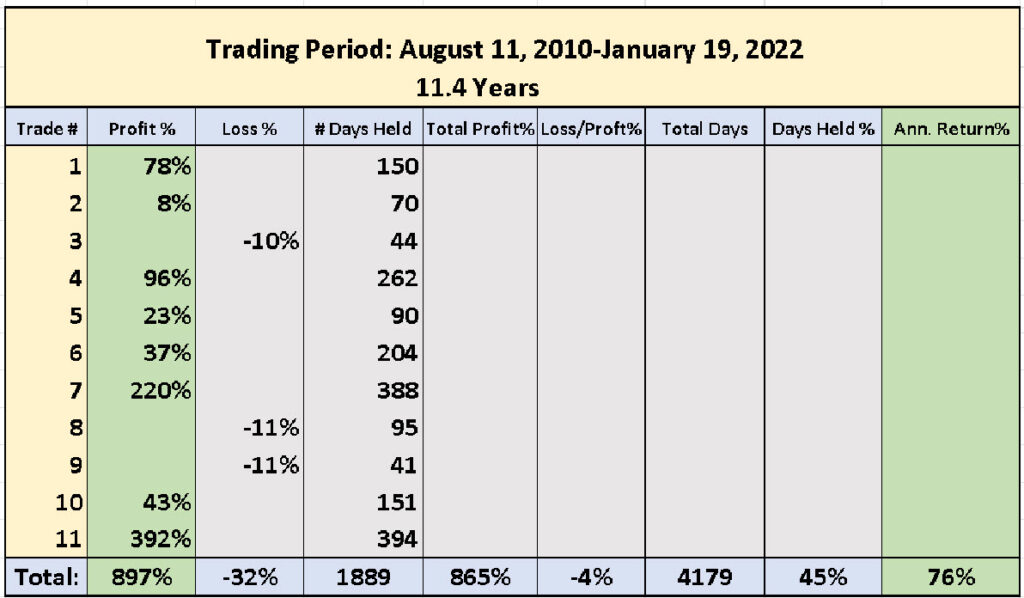
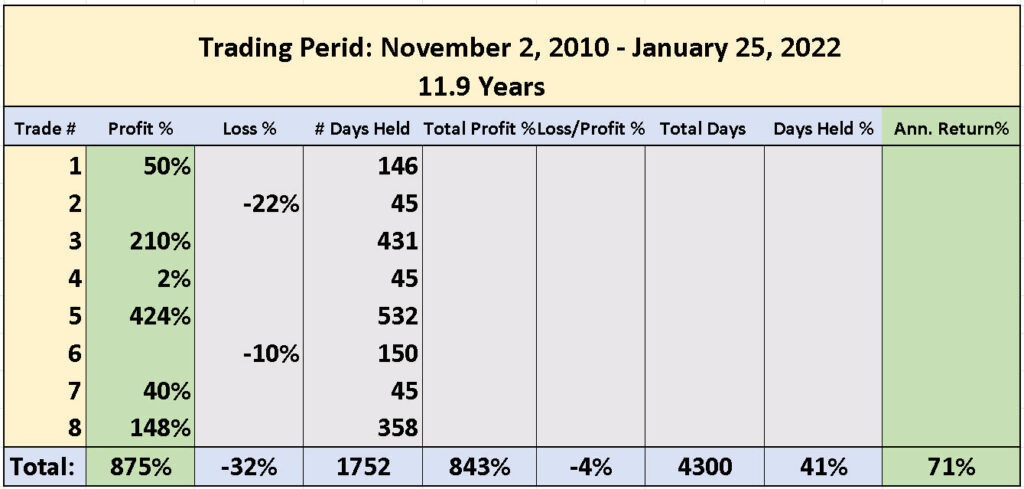
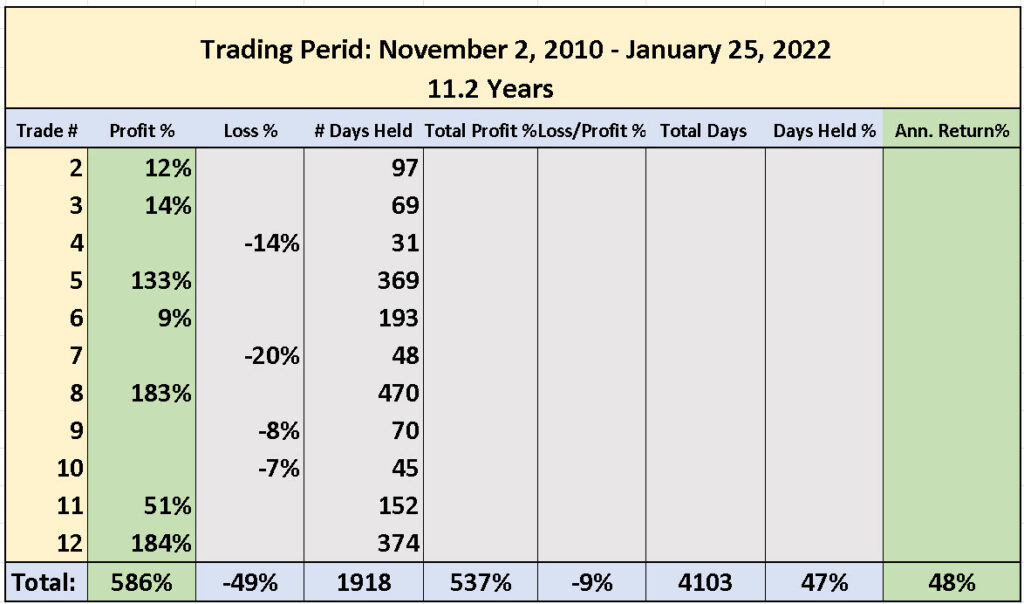
Our investment model successfully anticipated
the bull 2020 and bear 2022 markets.

TQQQ (3x Nasdaq-100 Index shares) Trading Performance for 11.4 Years
SOXL (3x Semiconductor Index shares) Trading Performance for 11.9 Years
TECL (3x technology Index shares) Trading Performance for 11.2 Years
SPXL (3x S&P 500 Index shares) Trading Performance for 11.25 Years

*Past performance does not guarantee future returns. The performance shown is based on proforma calculations using identical mathematical formulas for all ETFs. All ETFs reflect 3x of the leverage of the underlying index. Returns ETFs. All ETFs reflect 3x of the leverage of the underlying index. Returns do not include earned interest when portfolio proceeds are held in cash. Portfolio returns are not adjusted forproceeds are held in cash. Portfolio returns are not adjusted for commissions or management fees. All data used in this presentation is believed to be accurate but is not guaranteed. in this presentation is believed to be accurate but is not guaranteed.
©World Capital Management, 2023. Telephone 1-415-386-7111 Email: info@WorldCapitalManagement.Org